EN
EN UA
UA


 Login
Login 
Statistics
1. Product Activity
The “Product Activity” report is designed to check certain product parameters for activity, which may affect the ability to sell selected products. In simpler terms, by building this report, you can determine whether it will be sold at points of sale.
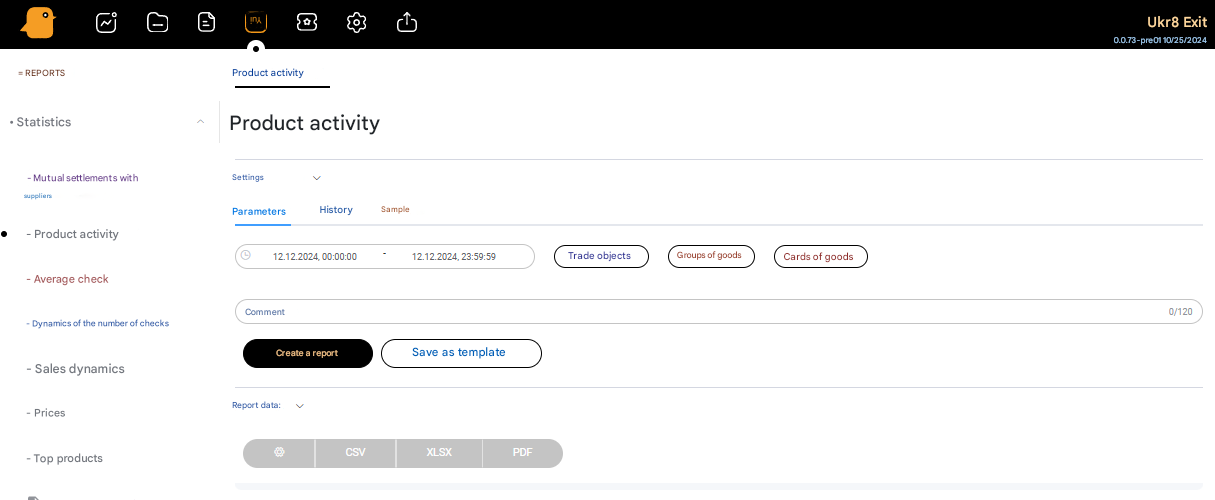
To use the product activity check, you need to:
- Go to Reports – Statistics – Product Activity;
- Click on the Trading Objects button and select the trading points at which you need to check the activity. If you don’t need to link to trading points, then you need to uncheck all points;
- Click on the Product Groups button and select the groups to check the products that are included in them for activity. Or do not select anything and also remove the activity from the groups, like the previous item;
- Press the Product Cards button and select the products from the list, then press the Save button. It makes sense to select products from the list when you need to display a small number of products, and the filter by points and product groups cannot meet all the sorting parameters;
- Click the Create Report button. A list of products will load.
All the points described above allow you to check product activity by trading points, by product groups or products, and in a combination of these components.
2. Average check
The report allows you to build graphs by average check over a period of time for all or some trading points. You can build several types of reports: columnar, circular, textual, or download it to a CSV, XLSX or PDF file.
To create a report, you need to set the time period for which the report will be created, add trading objects and click the Create Report button.
3. Dynamics of the number of checks
This type of report shows the dynamics of the number of checks for the selected trading points and over a period of time. To build a report, set a filter by period (date, time), detailing (daily, days of the week, months, years) or by trading objects and click the Create Report button..
4. Sales Dynamics
This type of report shows the dynamics of sales for the selected trading points and over a period of time.
To build a report, set a filter by period (date, time), detailing (daily, days of the week, months, years) or by trading objects and click the Create Report button..
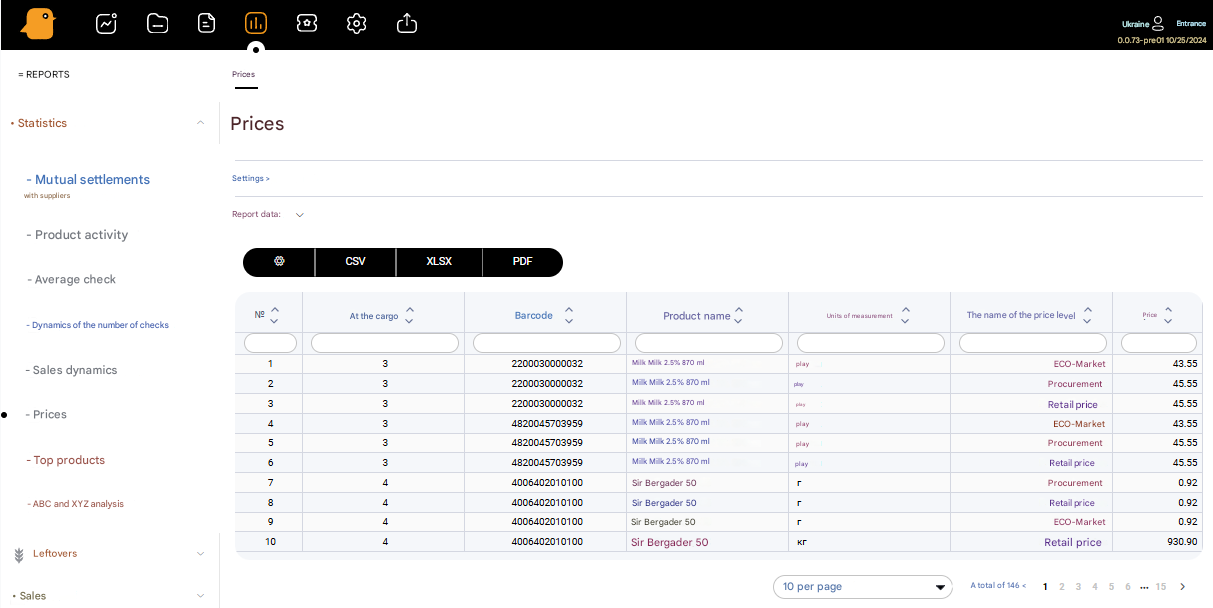
5. Prices
In the Reports – Statistics – Prices section, you can view a report by different price levels at points of sale. To do this, press the Price Level button to select the type of price for which to build the report, select Products or Group of products and press the Create Report button to display the report.
6. Top of products
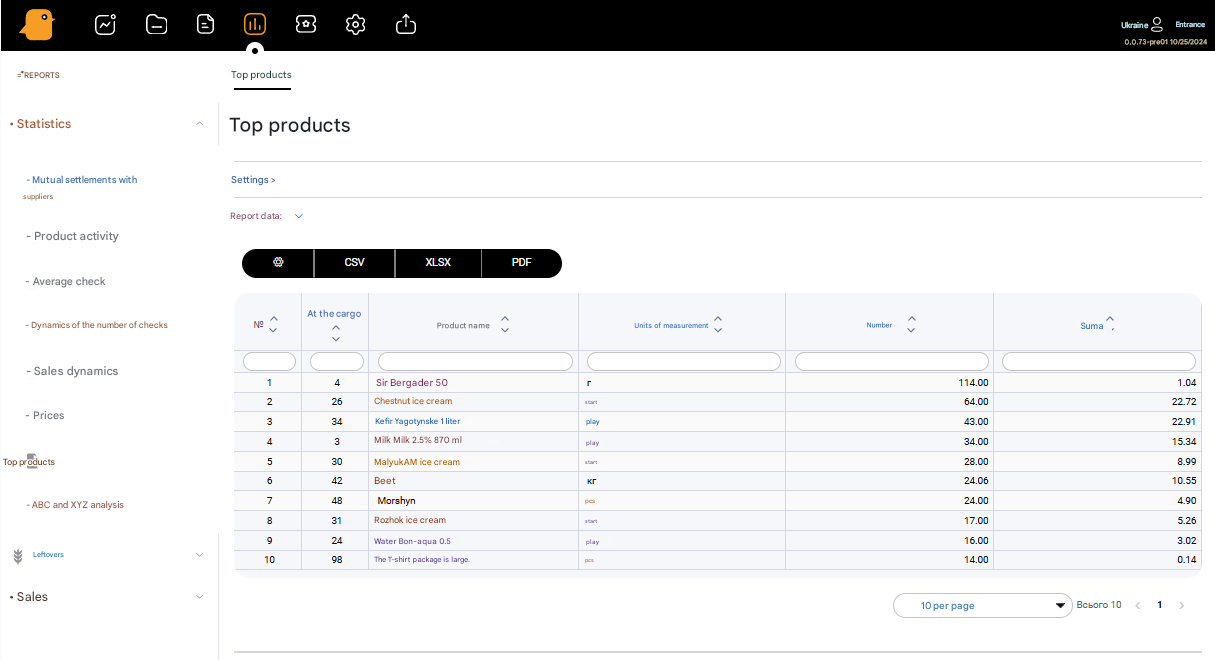
The “Top of products” report allows you to track the top (3, 5, 10, 20, etc.) products that are sold for a selected period of time or by the number of sales (units), or by the amount of sales. The document opens in two options: it is displayed on the screen or exported to a file.
The report is a sales statistic, making a list of the most demanded products at the point of sale or across the network. The table provides information about the product, namely: about its place in the TOP, product code, product name, quantity sold and amount.
7. ABC and XYZ analysis
ABC and XYZ analysis will allow you to analyze the range and determine based on the volume and uniformity of sales, which products should be in sufficient quantity, and which, on the contrary, can be removed from the range.
After creating the report, you have the option to download it in different formats: CSV, XLSX, PDF